Geospatial Visualization
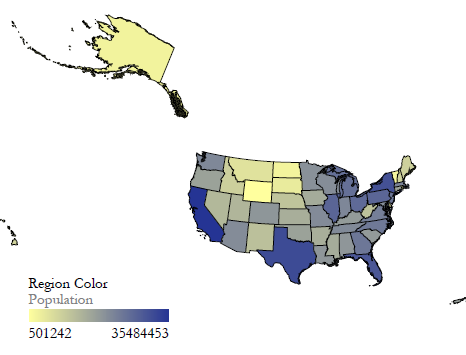
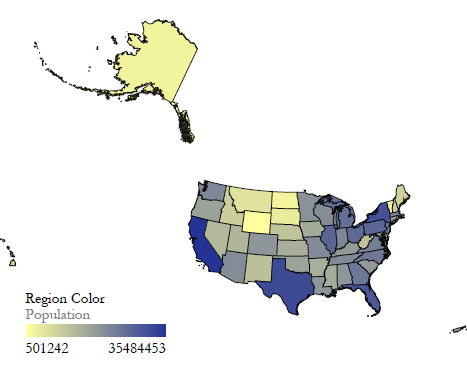
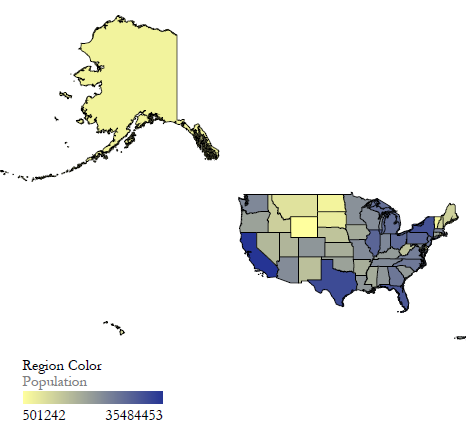
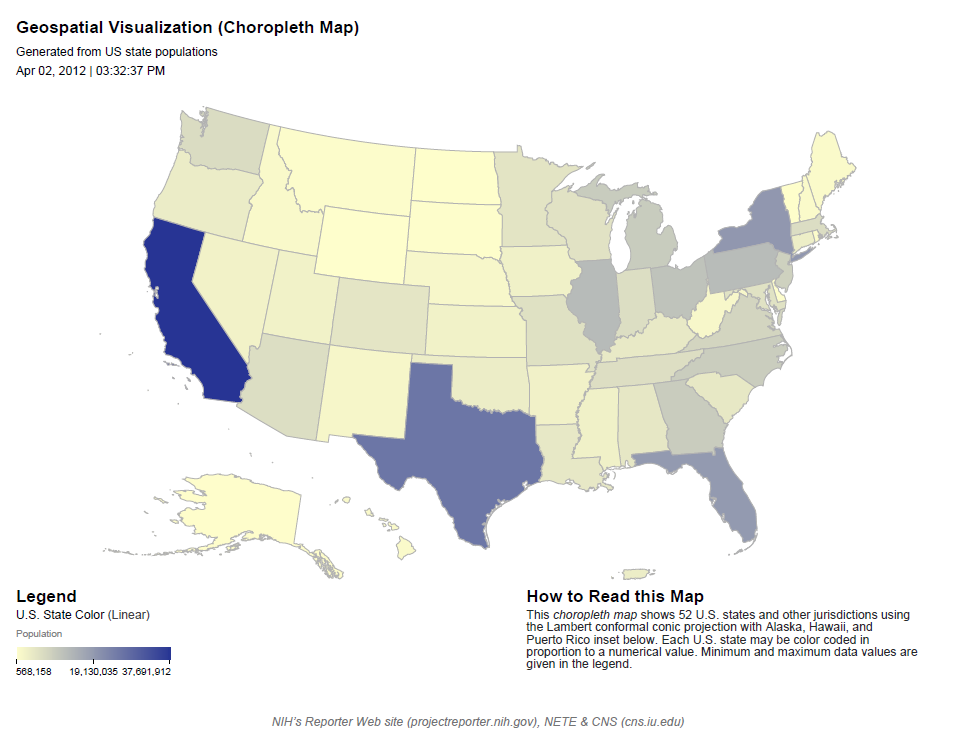
Choropleth Map
Color-codes named regions on a geographical map in proportion to associated numeric data.
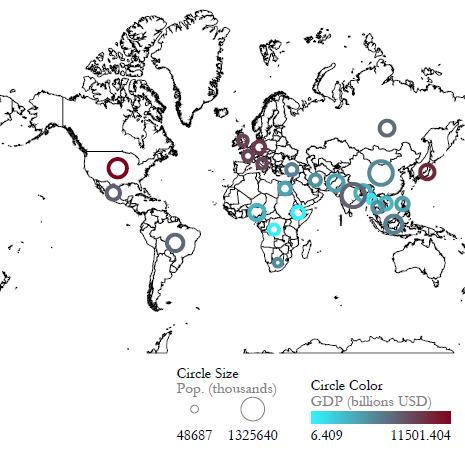
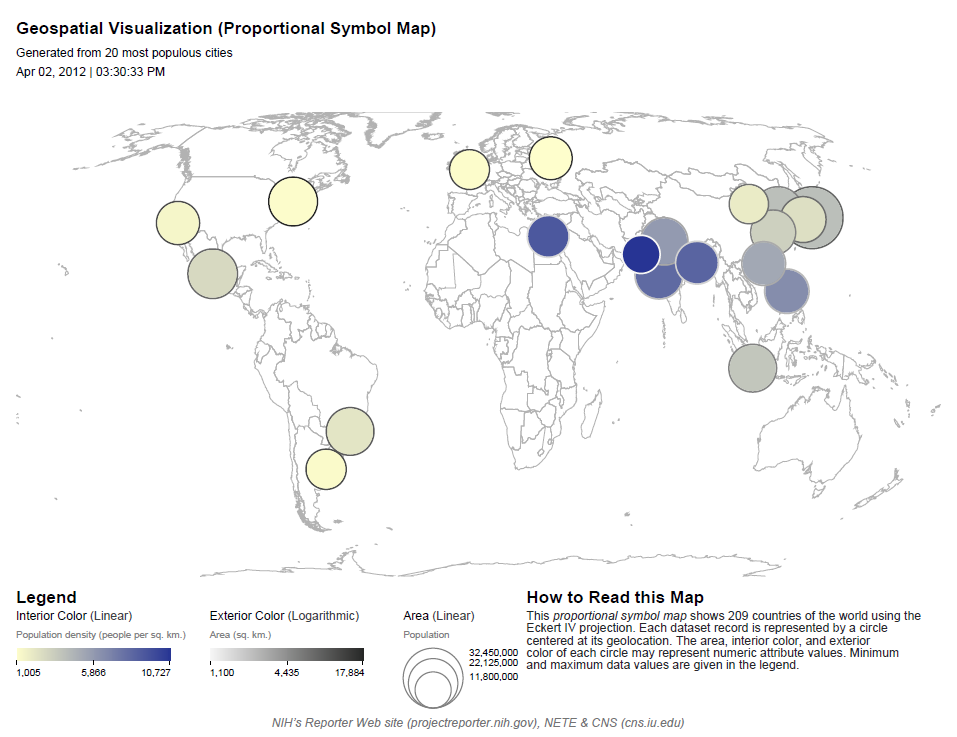
Proportional Symbol Map
Maps geospatial coordinates as circles that can be size- and color-coded in proportion to associated numeric data.
Geospatial Network Layout with Base Map
Overlaying a network on a geographical map
Examples
See these sections of the Sci2 tutorial:
The license could not be verified: License Certificate has expired! Generate a Free license now.
Attachments:
usStatePopulationsYellowToBlueAlbersEqualArea.png (image/png)
usStatePopulationsYellowToBlueLambertConformal.png (image/png)
usStatePopulationsYellowToBlueMercator.png (image/png)
top25WorldPopulationWithGDP.png (image/png)
countryNamesForRegionMap.csv (text/csv)
country-names-identified-by-the-geo-maps-shapefile-for-countries.txt (text/plain)
us-state-names.txt (text/plain)
us-state-populations.pdf (application/pdf)
us-state-populations.png (image/png)
area-population-and-population-density-of-20-most-populous-cities.png (image/png)
us-state-populations.pdf (application/pdf)
area-population-and-population-density-of-20-most-populous-cities.pdf (application/pdf)