Loading and Saving Geovisualization Files in Sci2
This algorithm allows for the geospatial visualization of network data. The algorithm produces a network file and corresponding blank map. Gephi is used to edit the network produced by Sci2. Once the network has been edited in Gephi it can be exported in a format that will allow it to be overlaid on the map, facilitating visualization of the geospatial data. The following is a brief workflow explaining the process, beginning to end.
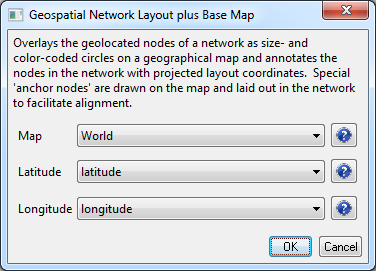
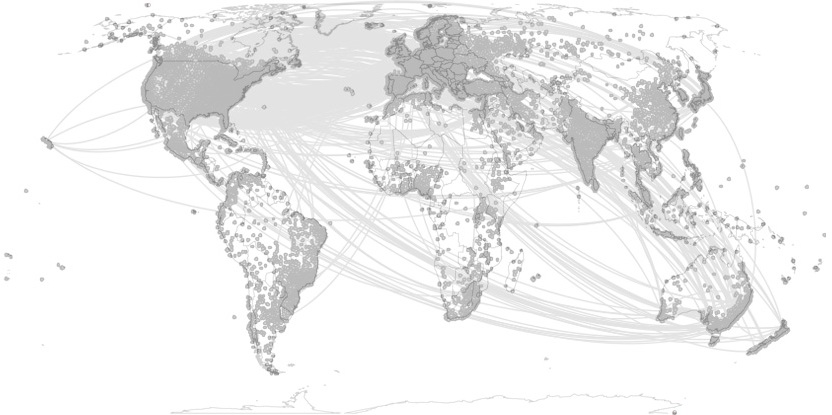
Select a network with geolocated nodes in Sci2 and run Visualization > Geospatial > Geospatial Network Layout with Base Map. If your network does not already have longitude and latitude values attached to its nodes, you may be able to generate them using Geocoder or Yahoo! Geocoder.
Take this network as an example.
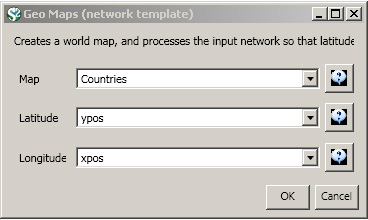
Select a base map and identify the network's latitude and longitude columns:
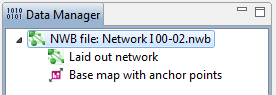
Two output data are generated:
- A copy of the input network with three new attributes:
xandygive the layout position of each nodeisAnchoris0for nodes from the input network and1for the inserted anchor points
- A PostScript file representing a blank visual base map onto which this new network can be overlaid

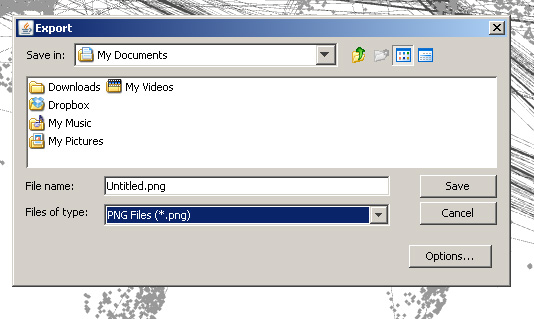
You will want to save both files. First, right click on the network file and save it to your computer in the GraphML (Prefuse) format. Note, you may still need to change the network file type to a .graphml file. Now right click on the map file and save it to your computer in the PostScript format.
Showing File Extensions
Windows XP: You can have the file extensions shown in the folder where you have saved the network file. In the folder, follow this path: "Tools > Folder Options" and select the view tab. Once you have done this you can deselect the "Hide extensions for know file types" box.
Windows 7: Open folder options by following this path: "Start > Control Panel > Appearance and Personalization > Folder Options" Now click the view tab. Under the Advanced Settings you can deselect the "Hide extensions for known file types" box.
Once the network file has been saved as a .graphml file it can be loaded into Gephi. (If you do not currently have Gephi, it is freely available here and Gephi tutorials have been made available here.)
Manipulating the Network File in Gephi
1. When you open Gephi select "Open a graph file" from under the "New Project" heading. Find the folder where you save the network file and load the .graphml version of the network file. The "Import Report" pop-up will display, informing you that they network will be loaded as an undirected network. Click OK:
2. Once the network has been loaded you can view the graph in the "Overview" panel. The network had two special anchor nodes that correspond to two anchor points drawn on the base map. These anchors will aid alignment of the network overlay on top of the base map. In order to make these nodes more visible in the network file you will want to change their colors.
3. Go to the "Data Laboratory" tab (in the top left-hand corner of the Gephi tool).
4. Make sure you have the "Nodes" tab selected, you will see a list of all the nodes in the network. Find the two anchor nodes. Their labels will be of the form "Near Place" value will be 1 in the isAnchor column.
5. Right click on the first anchor node and select the "Edit node" option. This will bring up the Edit function on the left-hand side of the screen:
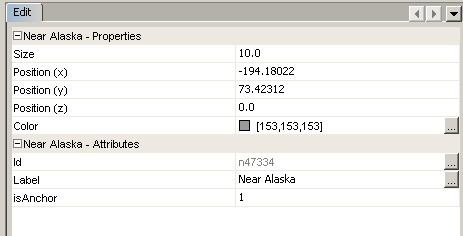
6. You can now adjust the color to make the nodes more visible. Repeat the same process for the other anchor node.
7. Return to the "Overview" tab and you will notice that the nodes have been colored based on your specifications.
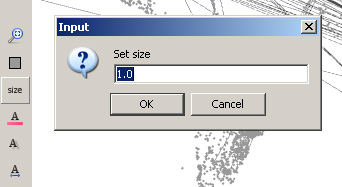
8. Next you will want to resize the nodes and decrease the edge weight to make the network more visible in the resulting visualization. You can change the size by right-clicking on the size button in the lower left-hand side of the "Graph" screen:
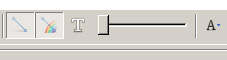
9. Decrease the Edge weight using the slider bar at the bottom of the "Graph" screen:
Saving the Network in Gephi
1. You will want to save the network in Gephi so that it is easy to open in Photoshop. Run File > Export > SVG/PDF/PNG file...:
Creating the Combined Visualization in Photoshop
1. Open both the map file and the newly edited network file in Photoshop (note they will initially be in separate files).
2. Go to the tab with the network file in it. Right-click on the layer and select "duplicate layer." A pop-up box will ask you for the destination, select the map file as the layer's destination.
3. Now in the map file tab, you will need to move the network layer on top of the map layer and change the opacity to make the underlying map more visible.
4. Any resizing that needs to be done in order to line up the colored nodes on the network file and their corresponding dots on the map file can be done by selecting the top layer and using Edit > Transform. Tip: hold down shift while doing using the transform and it will be done to scale. The resulting visualization will look like this:
