Description
Tracing its ancestry to Venn diagrams (Venn,1971), the Treemap algorithm was developed in the HCI Lab at the University of Maryland. It uses a space filling technique to map a tree structure (e.g. file directory) into nested rectangles with each rectangle representing a node. A rectangular area is first allocated to hold the representation of the tree, and this area is then subdivided into a set of rectangles that represent the top level of the tree. This process continues recursively on the resulting rectangles to represent each lower level of the tree, each level alternating between vertical and horizontal subdivision.
The parent-child relationship is indicated by enclosing the child-rectangle by its parent-rectangle. That is, all descendents of a node are displayed as rectangles inside its rectangle. Associated with each node is a numeric value (e.g. size of a directory) and the size of a nodes rectangle is proportional to its value. Ben Shneiderman's 'Treemaps for space-constrained visualization of hierarchies' webpage provides the full story. Many efforts have been made to make the space filling technique more effective in visualizing information hierarchy:
- Asahi et al. (1994) explored the use of treemaps in the Analytic Hierarchy Process (AHP). Their system allows users to interactively change and see the influence of different factors providing another example of dynamic queries (Ahlberg et al., 1992) or animated sensitivity analysis (Jones,1992).
- Vernier and Nigay proposed a method to assign a variable height and width to each node.Van Wijk and Van de Wetering (1999) developed Cushion Treemaps that use shading techniques to make the tree structure more visible.
- Stasko and Zhang (2000) proposed a Focus+Context display and navigation techniques for enhancing radial, space-filling hierarchy visualizations.
- Graham Wills, Lucent Technologies (http://www.bell-labs.com/user/gwills) presented a clustering technique based on an enhanced treemap at IEEE_InfoVis 98. It introduces several modifications to the basic tree-map that produce a much better visual clustering. It can easily handle hierarchies with tens ofthousands of leaf nodes.
- Andrews et al. (1989) Late Breaking Hot Topics Proc., IEEE Visualization'97 and Andrews (1998) IEEE CG&A proposed a 3-D treemap giving the overall impression of pyramids growing upwards as the hierarchy is descended.
QuantumTreeMap Layout Algorithm
"Treemaps are a family of algorithms that are space-filling partitions of a two-dimensional area. Treemaps take as input a list of n numbers and a rectangle. They partition the area into nrectangles, one per input number. The rectangles are guaranteed to fill the input rectangle, and the rectangles are proportional in area to the list of input numbers. Treemaps are designed to be applied hierarchically, so any given resulting rectangle can itself contain a treemap, and so on, recursively." - 'Treemaps for space-constrained visualization of hierarchies'
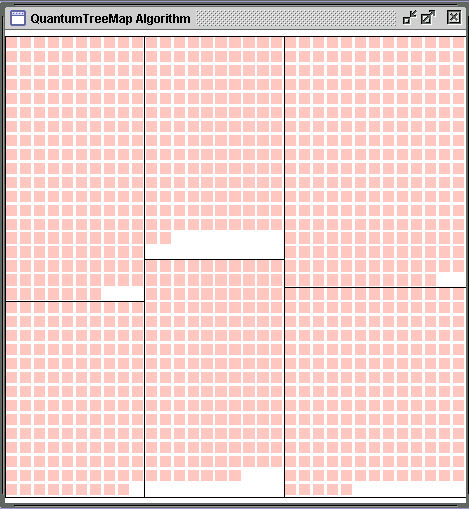
"The goal of the Quantum Treemap algorithm is similar to other treemap algorithms, but instead of generating rectangles of arbitrary aspect ratios, it generates rectangles with widths and heights that are integer multiples of a given elemental size. In this manner, it always generates rectangles in which a grid of elements of the same size can be layed out. Furthermore, all the grids of elements will align perfectly with rows and columns of elements running across the entire series of rectangles. It is this basic element size that cannot be made any smaller that led to the name of Quantum Treemaps." - 'Treemaps for space-constrained visualization of hierarchies'
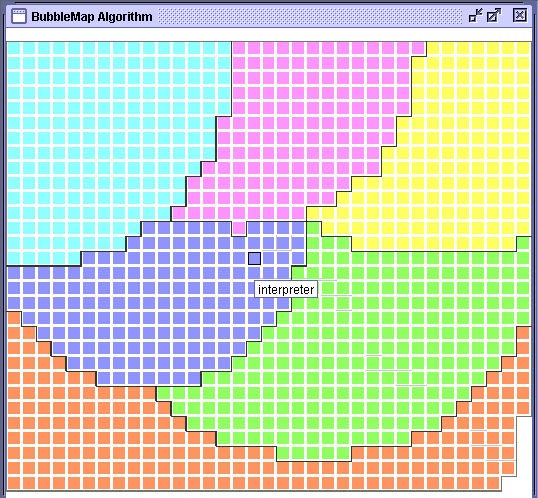
BubbleMap Layout Algorithm
"Bubblemap is a new algorithm which lays out groups of quantum-sized objects in an ordered position with no wasted space per group, although there is a small amount of wasted space for the entire area. The groups of objects can be created in different shapes, such as rectangular or circular, but the groups of objects only approximate those shapes, rather than define them exactly. The Bubblemap algorithm has also been integrated into PhotoMesa as a user-selectable layout option." - 'Treemaps for space-constrained visualization of hierarchies'
Links
- Source Code: http://www.cs.umd.edu/hcil/
- Binaries: ...
- Update Site: ...
- Home Page: http://www.cs.umd.edu/hcil/treemap/
Pros & Cons
Brian Johnson & Ben Shneiderman in their widely cited paper (1991) consider the algorithm "best suited to hierarchies in which the content of the leaf nodes and the structure of the hierarchy are of primary importance, and the content information associated with internal nodes is largely derived from their children."
Treemaps make 100% use of the available display space and efficiently display large trees in limited space. All the leave nodes can be viewed. Area-size and color coded attributes of a node can be recognized very easily.
Treemaps should not be used if the hierarchical structure of a LARGE data set needs to be conveyed.
Applications
SmartMoney Stock Market visualization shows 535 popularly held stocks that are organized by industry groups, size-coded by market capitalization, and color-coded to show rise or fall: http://www.smartmoney.com/marketmap/http://www.truepeers.com/
TruePeers People Maps http://www.truepeers.com/
DiskMapper http://www.miclog.com/dmdesc.htm
Marc Smith (http://research.microsoft.com/~masmith/) applies treemaps to visualize the structure of newsgroups.
Smithsonian Institution's HistoryWired web site introduces visitors to some of the three million objects held by the National Museum of American History, Behring Center using a interactive treemap designed by SmartMoney. http://historywired.si.edu/index.html
Implementation Details
In class, we will use the treemap implementations in the Information Visualization XML Toolkit.
Other packages:
Treemap from HCIL, University of Maryland is available at http://www.cs.umd.edu/hcil/treemap/index.shtml XDU is a program for displaying a graphical tree of disk space utilization as reported by the UNIX utility "du". You can navigate up and down in the tree, sort things, and print out information.
Usage Hints
Read Visualizing Tree Data to learn how to run and use the existing code.
Acknowledgements
The code was taken from www.bouthier.net. Nathan James Deckard integrated the code into the XML Toolkit.
References
- Ahlberg, C., Williamson, C. and Shneiderman B. (1992) Dynamic queries for information exploration: An implementation and evaluation. In Proceedings of ACM SIGCHI'92, 619-626.
- Asahi, T., Turo, D. and Shneiderman, B. (1994) Using treemaps to visualize the analytic hierarchy process. Technical Report CAR-TR-719, Department of Computer Science, University of Maryland, College Park, MD. Chris Jones well-written tutorial on treemaps can be found at http://orcs.bus.okstate.edu/jones98/treemaps.htm
- Jones, C. V. Animated sensitivity analysis. (1992). In O. Balci, R. Sharda, and S. A. Zenios, (eds.), Computer Science and Operations Research: New Developments in their Interfaces, pp. 177-196. Oxford, United Kingdom: Pergamon Press.
- Johnson, B. & Shneiderman, B. (1991) Treemaps: A space-filling approach to the visualization of hierarchical information structures. In Proceedings of the 2nd International IEEE Visualization Conference, 284-291. Treemaps for space-constrained visualization of hierarchies http://www.cs.umd.edu/hcil/treemaps/
- Shneiderman, B. (1992) Tree visualization with tree-maps: 2-d space-filling approach. ACM Transactions on Graphics 11(1) (Jan. 1992), 92-99.
- Jark J. van Wijk & Huub van de Wetering (1999) Cushion Treemaps: Visualization of Hierarchical Information. IEEE Sysmposium on Information Visualization(INFOVISí99).
- Frederic Vernier and Laurence Nigay: Modifiable Treemaps Containing Variable-Shaped Units.
- J. Stasko and E. Zhang (2000) Focus+Context Display and Navigation Techniques for Enhancing Radial, Space-Filling Hierarchy Visualizations. Graphics, Visualization, and Usability Center, Georgia Institute of Technology, Atlanta, GA, Technical Report GIT-GVU-00-12, August 2000.
- Vernier, F., & Nigay, L. Modifiable Treemaps Containing Variable-Shaped Units. (in progress, the article can be found in .pdf format at http://iihm.imag.fr/vernier/HCILTalk.html).
- Venn, J. (1971). Symbolic Logic (2nd. Ed.). Bronx: Chelsea Publishing Company. Reprint of 1894 edition.